Use Cases We Didn't Design
Three times in one week, our users did something with the product we never imagined. Each instance taught us something fundamental about the difference between building a tool and building a platform.

TL;DR
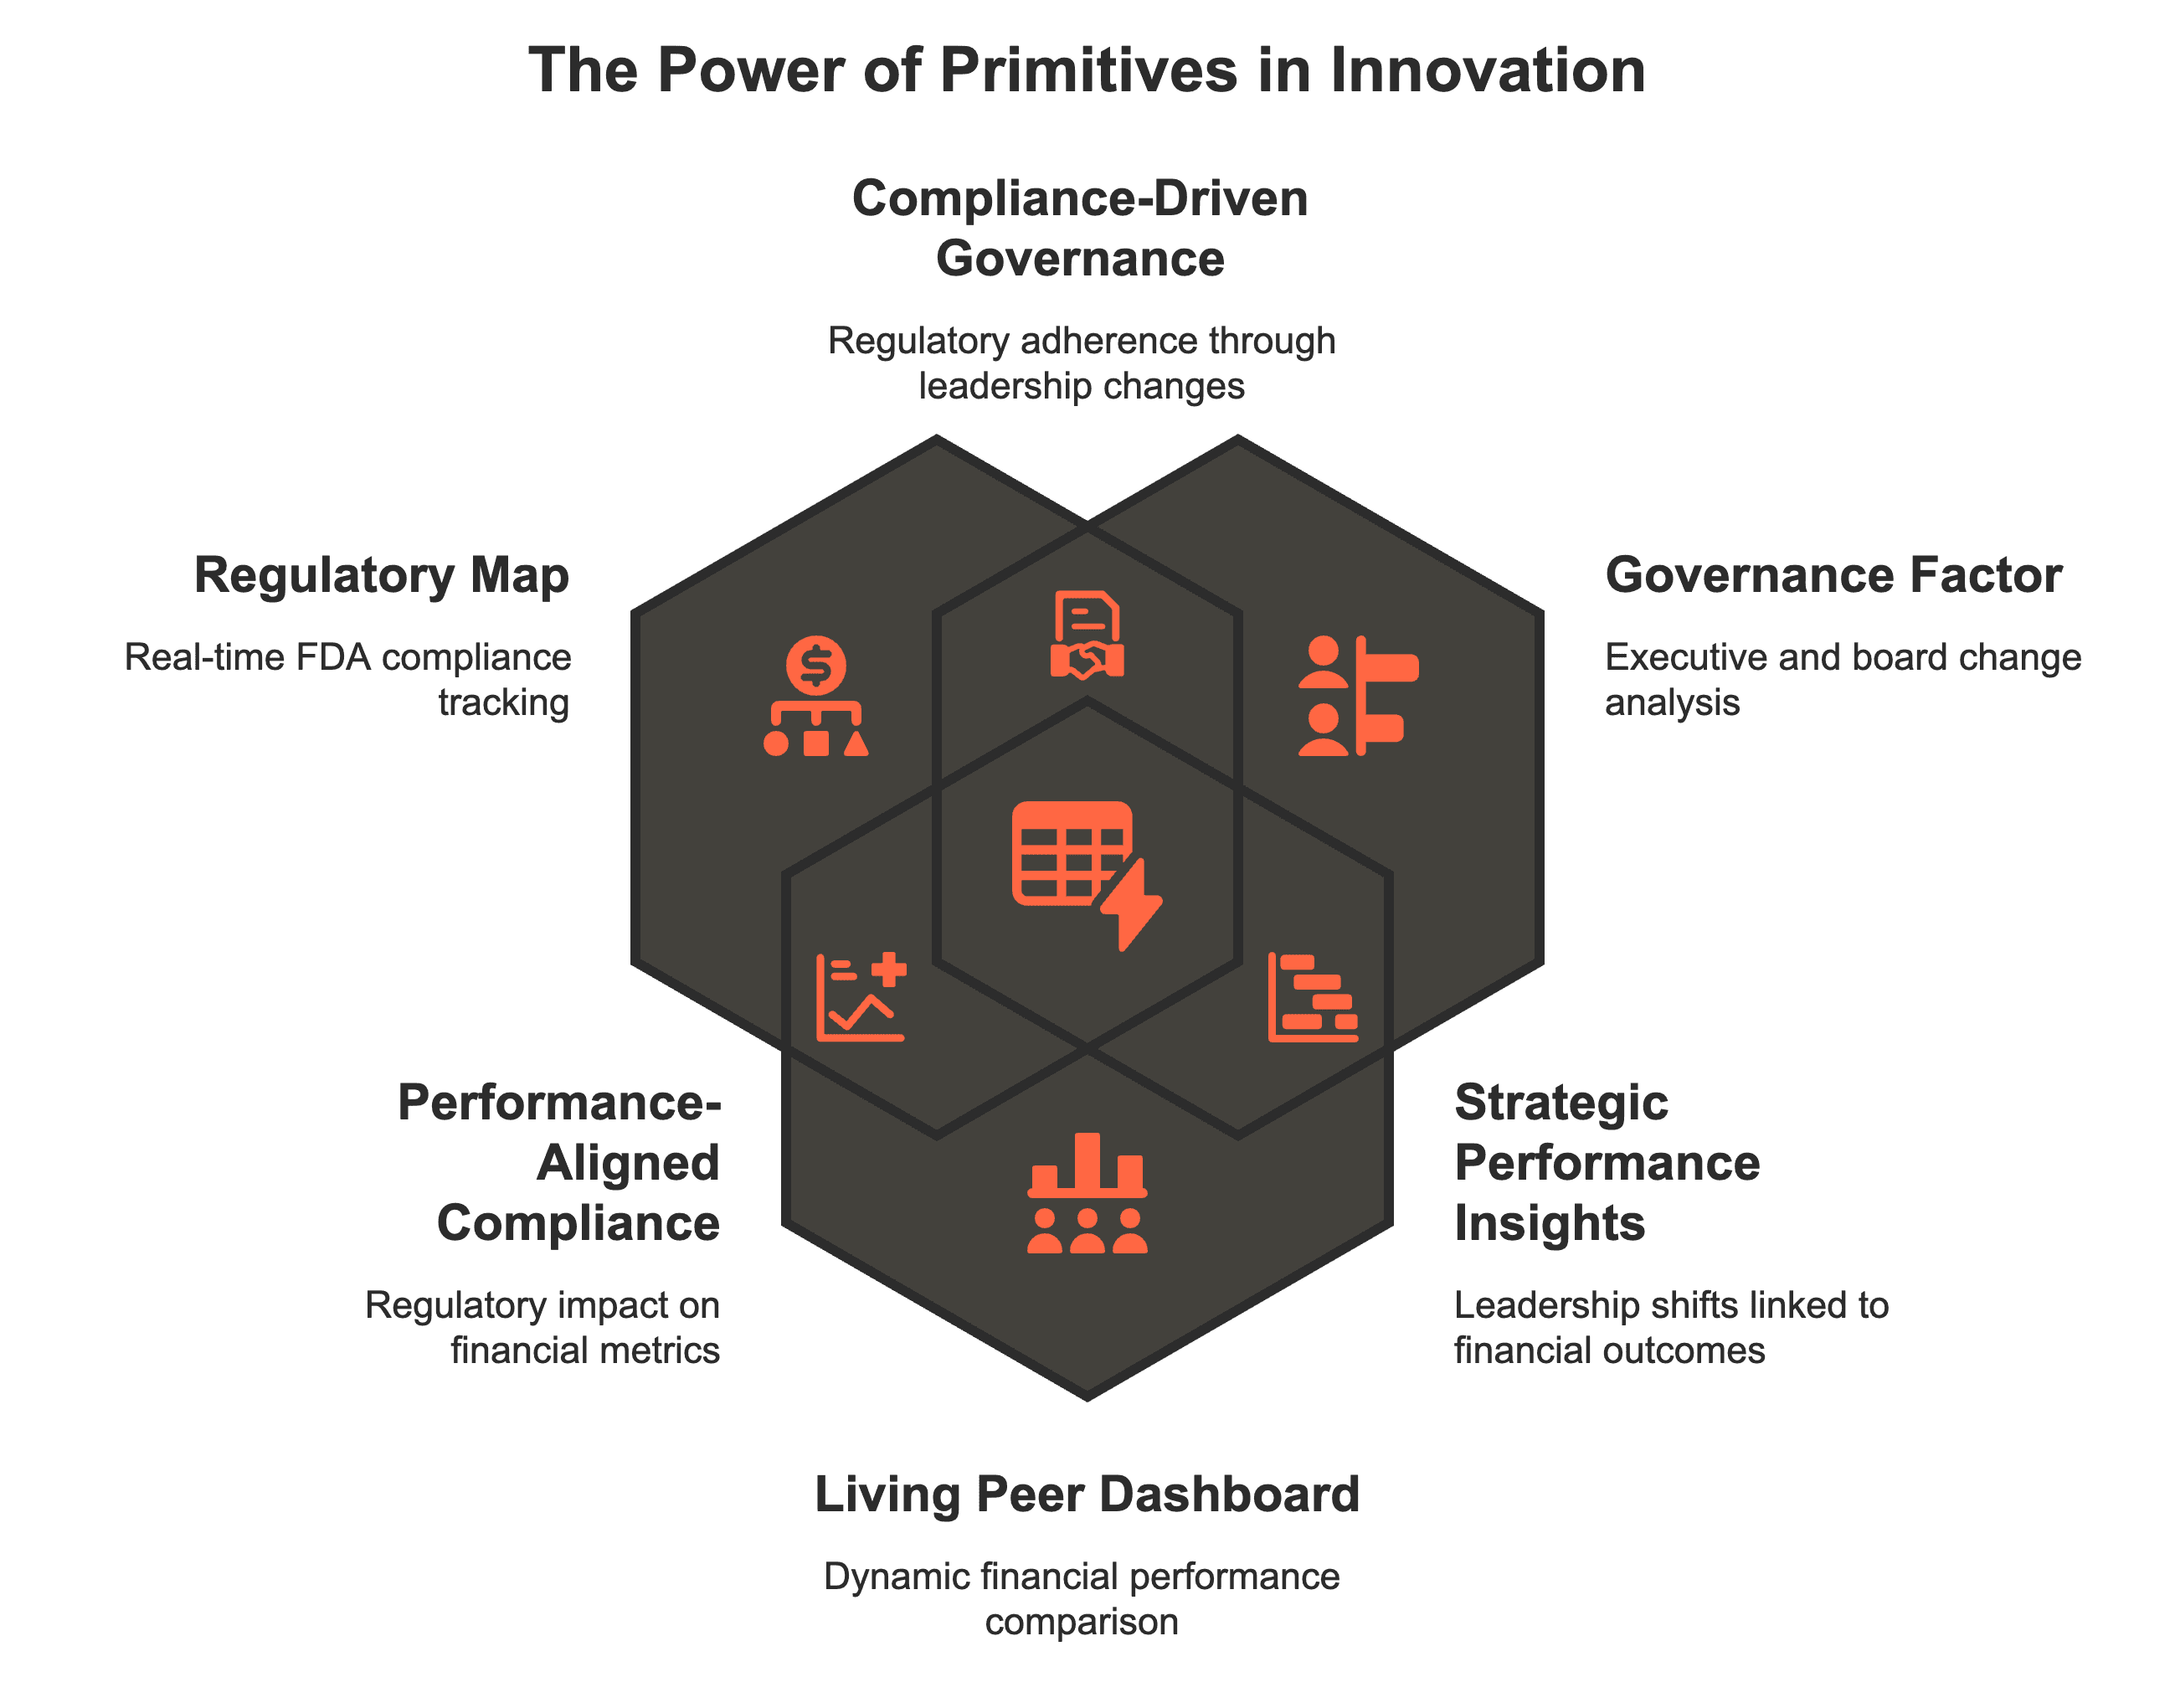
Three users independently built capabilities we never imagined -- a regulatory read-through map, a governance-based quantitative screen, and a living peer dashboard -- by composing our system's primitives in novel ways. The lesson: building composable infrastructure instead of fixed features lets domain experts create solutions that a product team would never think to ship.
There's a moment in every startup's life when the product stops being yours.
Not in a bad way. In the way that matters. The moment when the people using your system start doing things with it you never imagined, things that are smarter, more creative, and more revealing than anything on your carefully maintained product roadmap.
For us, that moment happened three times in the same week. And each instance taught us something fundamental about the difference between building a tool and building a platform.
The Feature Set We Designed
Let me start with what we thought we were building.
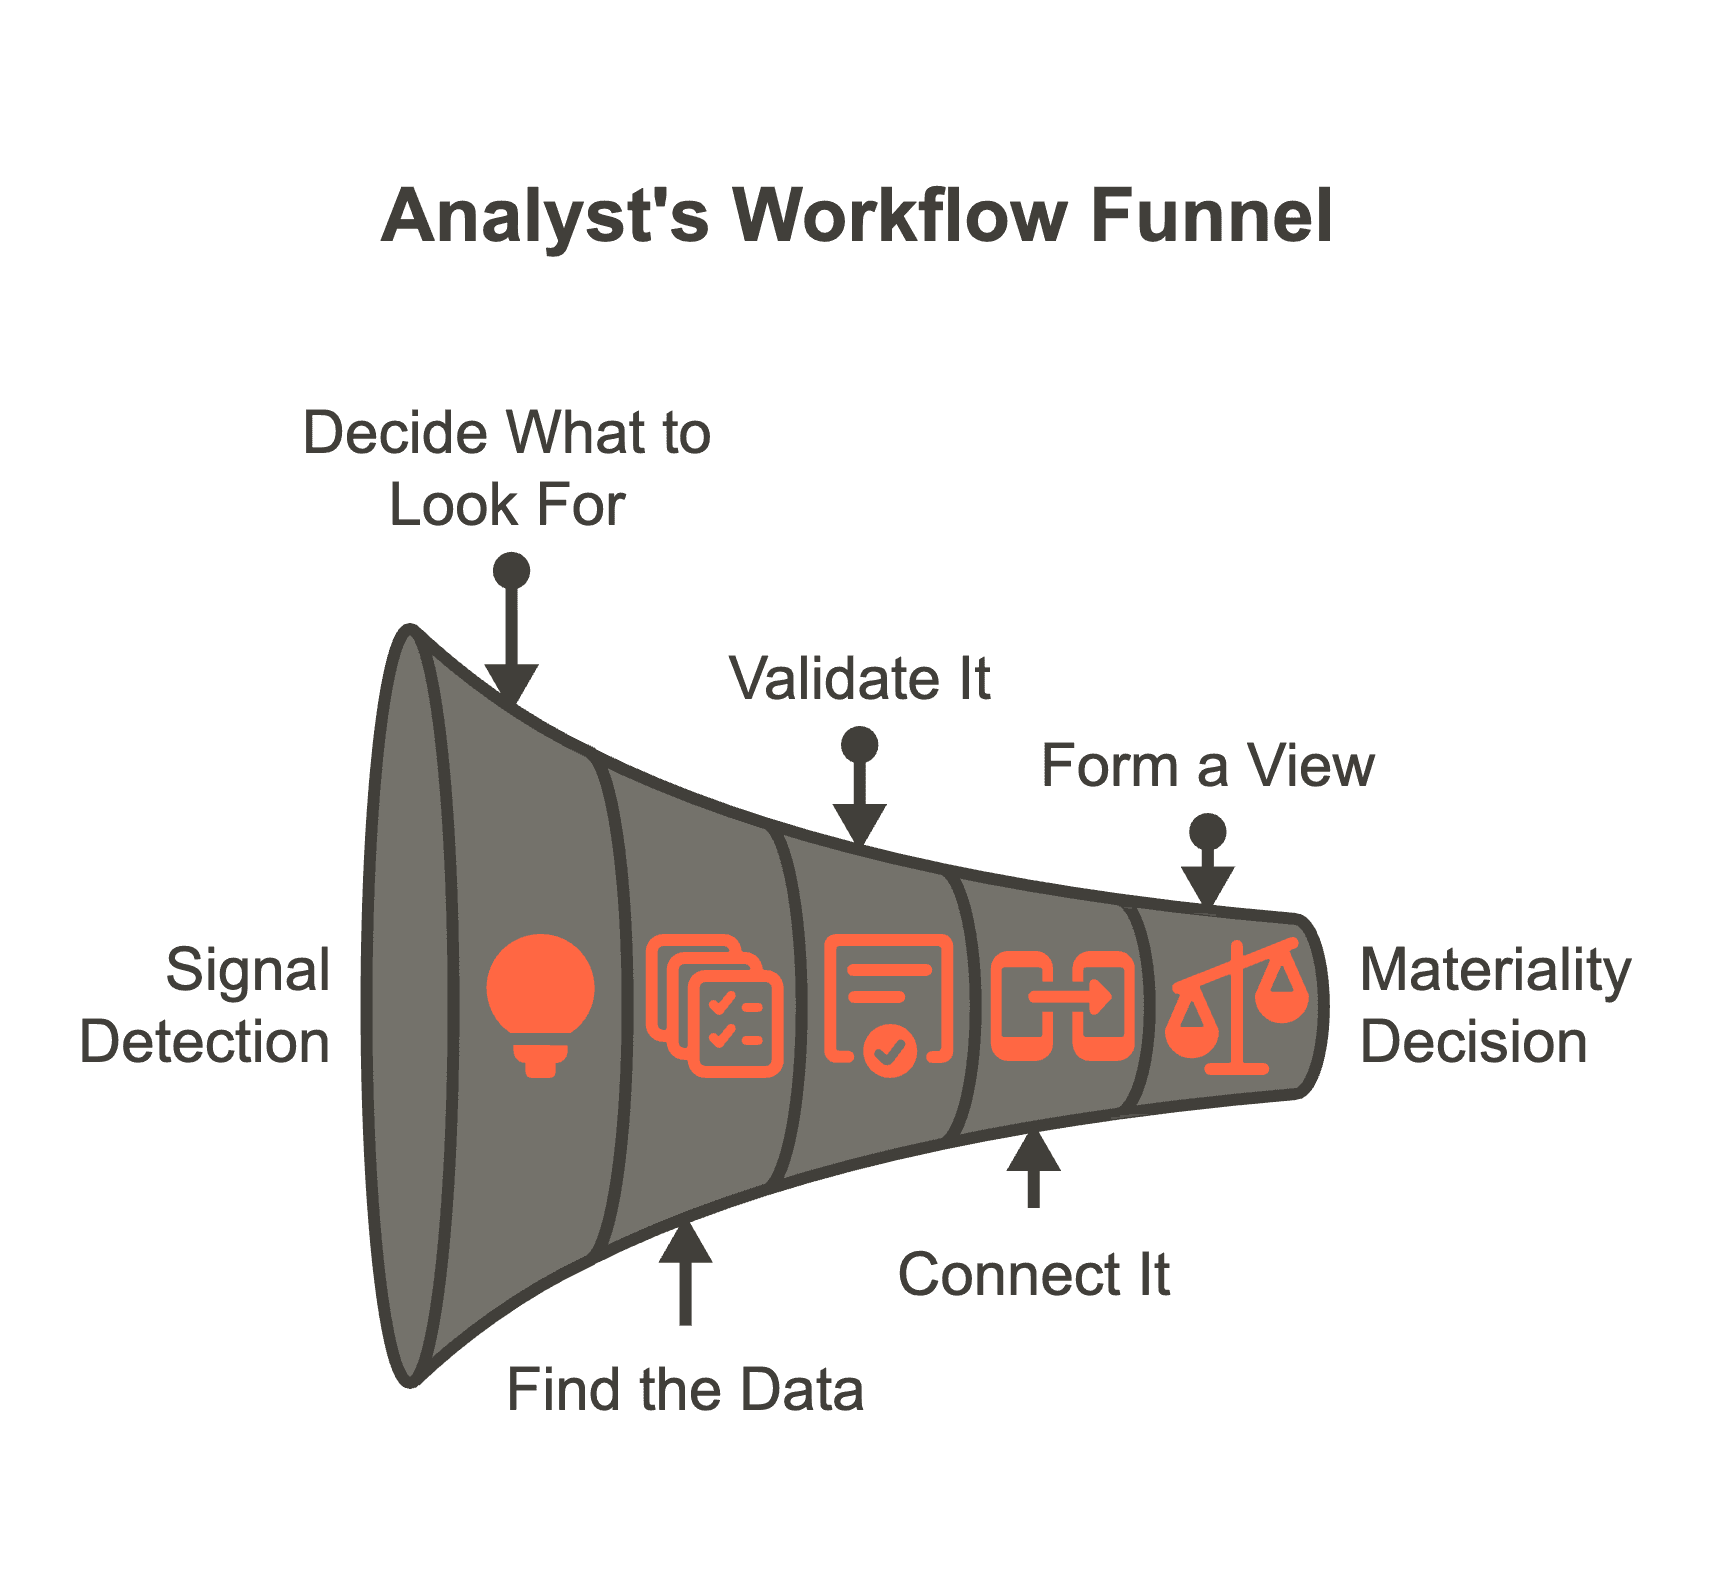
When we launched our early access program for KnowYourCompany.ai, the product was designed around a specific workflow: an equity analyst covering a universe of 15-20 companies, using AI to accelerate their daily research process.
The core features mapped to this workflow neatly:
Morning briefings: the system monitors overnight developments across coverage companies and surfaces material changes, ranked by significance.
Company deep dives: the analyst can investigate a specific company, with the system assembling filings, transcripts, news, and alternative data into a structured research view.
Thesis tracking: ongoing monitoring of key indicators that support or challenge the analyst's investment thesis on each coverage name.
Comparative analysis: cross-referencing data across peer companies, sectors, and time periods.
Each of these features was designed, tested, and refined based on months of user interviews. We had spoken to over 100 analysts before writing our first line of production code. We knew the workflow. We knew the pain points. We knew what to build.
Or so we thought.
Use Case #1: The Regulatory Map
The first surprise came from a healthcare analyst, call her Priya, who covers a portfolio of mid-cap pharma and specialty healthcare companies.
Priya's companies live and die by regulatory decisions. Drug approvals, advisory committee meetings, approval decisions, label expansions: these events move stocks 20-30% in a single session. For a healthcare analyst, tracking the regulatory calendar isn't a nice-to-have. It's the core of the job.
We had built basic regulatory monitoring into the system. When a CDSCO action appeared in a filing or news feed, it would be flagged in the company's morning briefing. Standard stuff.
Priya took it somewhere else entirely.
She started using our orchestration layer's custom trigger system, originally designed for financial metric thresholds, to build a cross-portfolio regulatory map. Instead of monitoring each company's regulatory events individually, she created a web of interconnected triggers.
If Company A's drug targets the same pathway as Company B's drug, and Company A receives an advisory committee date, Priya's system automatically flags the potential read-through for Company B. If a regulatory guidance document mentions a therapeutic area that affects three of her coverage names, all three get flagged simultaneously with cross-referenced context.
She wasn't tracking companies. She was tracking regulatory themes across her entire coverage universe.
Within two weeks, she had built a system that surfaced regulatory read-through implications that she told us would have taken her "half a day of manual scanning to piece together."
We had never imagined this use case. Our trigger system was designed for things like "alert me if capex-to-revenue exceeds 15%." Priya turned it into a regulatory intelligence platform.
Use Case #2: The Governance Factor
The second surprise came from a generalist portfolio manager, let's call him Rahul, who runs a concentrated long-short equity strategy.
Rahul's approach to investing is unusual. He doesn't specialize in a single sector. Instead, he looks for cross-sector patterns that indicate inflection points: management changes, capital allocation pivots, governance red flags. His edge, as he describes it, is "seeing the chess moves before they happen."
We had designed our system for single-company or sector-level analysis. Rahul used it for something completely different.
He connected our workflow engine to his watchlist of 200+ companies and built a custom monitoring system focused entirely on management turnover signals. He was tracking executive departures, board composition changes, auditor switches, and compensation structure modifications, not at individual companies, but as a portfolio-wide screening factor.
His logic: management turnover patterns, when analyzed across a large enough sample, predict strategic pivots that haven't been announced yet. A CFO departure followed by a board refresh followed by an auditor change, that sequence, in Rahul's experience, precedes a major capital allocation shift roughly 70% of the time.
No single data point is interesting. The sequence across multiple companies is the signal.
Rahul had essentially built a governance-based quantitative screen on top of our fundamental research platform. He was using our company analysis tools not to analyze companies, but to identify patterns of behavior across hundreds of them simultaneously.
When he showed us what he had built, our first reaction was: "We didn't know you could do that with our system."
His response: "Neither did I, until I tried."
Use Case #3: The Living Peer Dashboard
The third surprise came from an industrials analyst, I'll call him Vikram, who covers a universe of 18 specialty manufacturing companies.
Vikram has a thesis that the most reliable leading indicator for his coverage universe isn't revenue growth or order backlog. It's operating margin trajectory relative to peers. When one company's margins start diverging from the peer group, it either signals a company-specific competitive advantage or an accounting issue worth investigating. Either way, it's worth knowing about.
We had built peer comparison as a feature; you could pull up two or three companies side by side and compare financial metrics. It was designed as an on-demand tool: when you need a comparison, you run one.
Vikram turned it into a continuous monitoring system.
He configured our workflow engine to run a peer margin analysis every time any company in his coverage universe filed new financials. Not on demand, automatically. The system maintained a rolling 12-quarter margin comparison matrix for all 18 companies, updated in real-time as new data arrived.
But he didn't stop there. He added custom thresholds: if any company's operating margin deviated by more than 150 basis points from the peer group median over two consecutive quarters, he wanted an alert with the full context, including management commentary from the most recent earnings call about margin drivers.
The result was a living peer dashboard that acted as an early warning system for both opportunities and risks across his entire coverage universe.
"I used to do this manually every quarter," Vikram told us during a feedback session. "It took two full days after earnings season. Now it just runs."
What These Three Stories Have in Common
When I sat with our team and reviewed what Priya, Rahul, and Vikram had built, the pattern was clear:
None of them were using the system the way we designed it. All of them were using it better than we designed it.
And the reason they could do that wasn't because our features were flexible, though they were. It was because of an architectural decision we had made early on that, at the time, felt like an engineering indulgence.
We had built KnowYourCompany.ai as a layered system, data platform, orchestration, workflows, agents, where each layer exposes capabilities that the layers above can compose in different ways. Our orchestration layer doesn't just run our pre-built triggers. It exposes a trigger framework that users can configure. Our workflow engine doesn't just execute our pre-designed workflows. It provides building blocks that users can assemble.
We didn't build features. We built primitives.
And it turns out that domain experts, people who deeply understand their own workflow, can compose primitives into solutions that a product team would never think to build.
The Tool vs. Platform Distinction
This experience crystallized something I'd been thinking about for months but hadn't been able to articulate clearly.
A tool does what you designed it to do. You identify a task, you build a solution, you ship it. The value is bounded by your imagination as a product builder.
A platform enables things you couldn't imagine. You build capabilities and composability. The value is bounded by your users' imagination, which, when your users are domain experts with decades of experience, is vastly larger than yours.
Most AI products in our space are tools. They do one thing well: answer questions about financial data. The interaction model is fixed. The use cases are predetermined. The value is real but bounded.
We stumbled into building a platform, not because we were visionary, but because our engineering architecture happened to expose the right primitives. Priya, Rahul, and Vikram showed us what a platform looks like. They composed our building blocks into solutions we would have never shipped as features.
This distinction has profound implications for our roadmap.
Instead of building more features, we're investing in better primitives. Instead of designing workflows, we're improving the workflow engine so users can design their own. Instead of prescribing how the system should be used, we're creating the conditions for analysts to surprise us.
What Our Users Taught Us About Equity Research
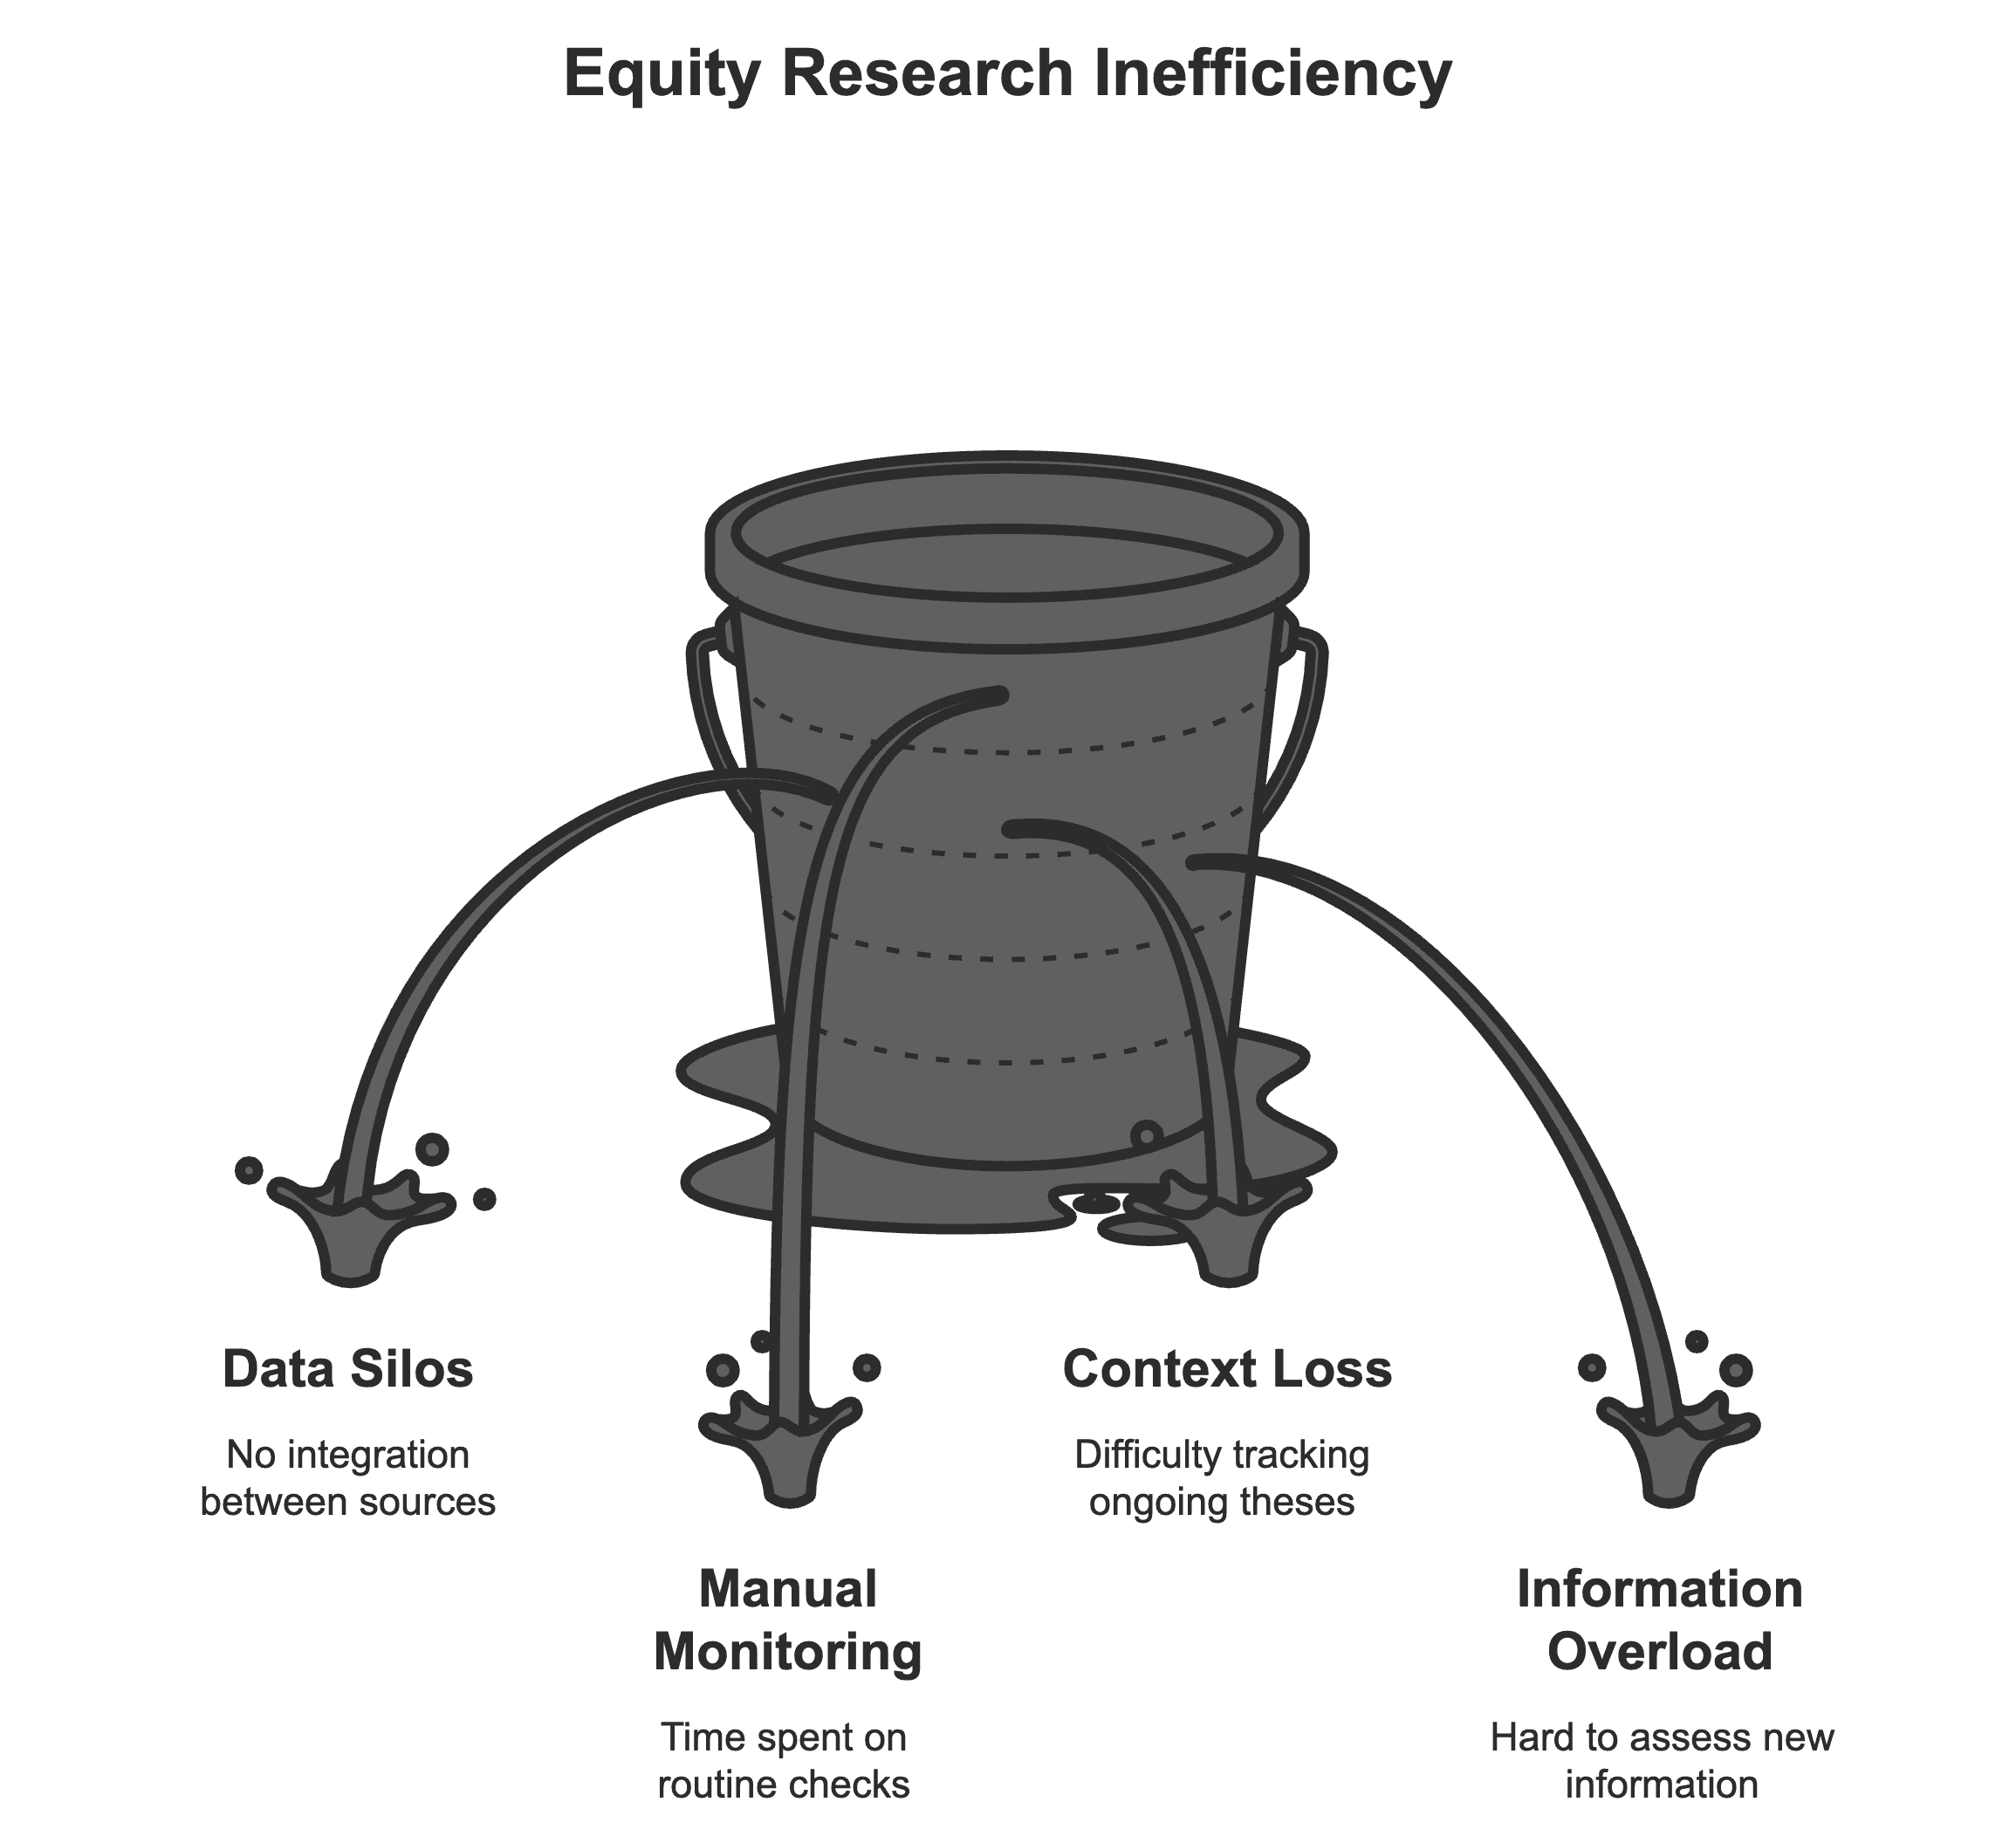
Beyond the product lesson, these three use cases revealed something important about equity research itself, something that challenges the dominant narrative in AI.
The narrative says: AI will replace the analyst's research process with faster, smarter automated analysis.
What we're seeing suggests something different: the most valuable application of AI in equity research isn't replacing the analyst's process. It's extending it.
Priya didn't want a system that tracked regulatory events for her. She wanted building blocks to construct a regulatory intelligence framework that reflected her unique analytical perspective.
Rahul didn't want automated governance analysis. He wanted the computational reach to apply his pattern-recognition methodology across 200+ companies instead of the 30 he could manually track.
Vikram didn't want a pre-built peer comparison dashboard. He wanted the infrastructure to maintain a living, continuously updated view of his coverage universe that matched his specific analytical framework.
In each case, the AI system's value wasn't in replacing human judgment. It was in amplifying it, giving expert analysts the ability to apply their hard-won analytical instincts at a scale that wasn't previously possible.
This is the difference between AI that thinks for analysts and AI that thinks with them. And based on what we're seeing from our early users, the second model creates dramatically more value.
Gratitude and What Comes Next
I want to end with something personal.
Building a startup is an exercise in humility. You start with a thesis, you build with conviction, and then, if you're fortunate, your users show you that your thesis was both more right and more wrong than you imagined.
More right, because the fundamental bet, that equity research needs an AI-native infrastructure layer and not just another chatbot, is validated every time a user composes our primitives into something new.
More wrong, because the specific use cases we predicted are only a fraction of what's actually emerging.
To our early customers: thank you. Not just for using the product, but for teaching us what it can become. The product we're shipping next quarter looks nothing like the one we planned six months ago, and that's exactly how it should be.
We're building this with you. And that, more than any feature on our roadmap, is what gives me confidence that we're working on something that matters.
Other posts in the Founder Stories series:
- We Spent 3 Months Building the Wrong Feature, lessons from an early product pivot
- Why I'm Betting on a New OS for Research, the personal bet behind the company
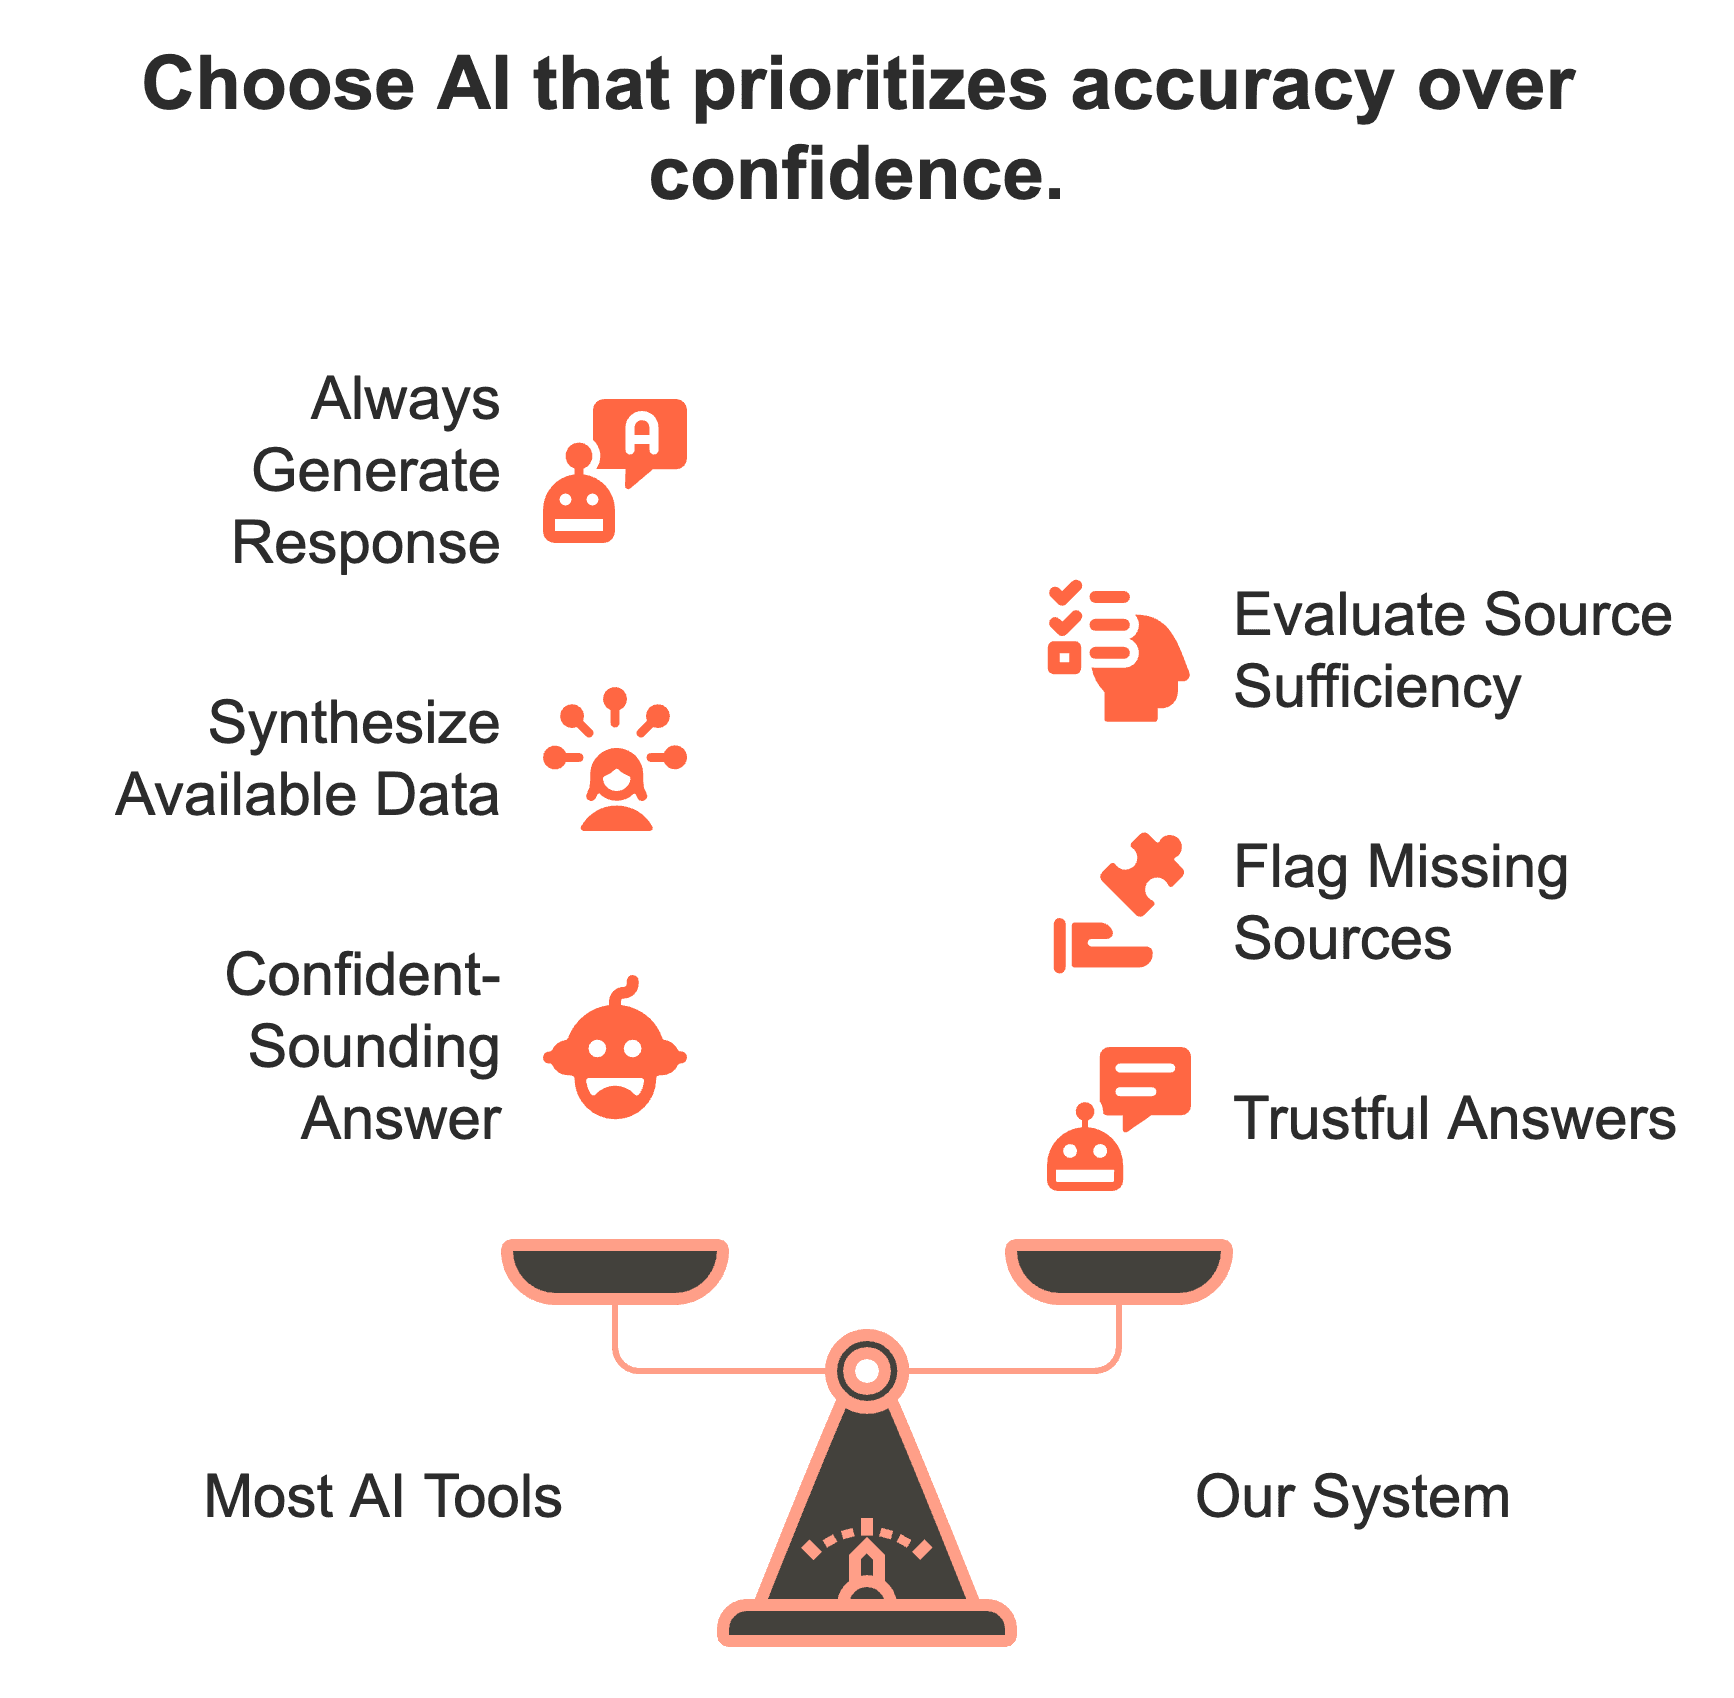
- We Taught Our AI to Say "I Don't Know", why we built honesty as a core feature
Enjoyed this article?
Get more insights like this delivered to your inbox weekly.